We publish this information to help customers understand how we are performing.
This information shows where we ended our Q1 performance (April - June 2026). Our Q2 performance (July - September 2026) will be available at the end of October 2026.
Your home
This section shows how we are looking after your home.
of emergency repairs were completed on time in June 2026. RP02(2)
This score is up from 94.9% last quarter. We aim to make 100% of emergency repairs safe within 24 hours of them being reported to us.
of routine repairs were completed on time in June 2026. RP02(1)
This is slightly down from 81% last quarter. We aim to complete routine repairs within 28 days.
of homes, for which all required gas safety checks, had been carried out in June 2026.
This is the same as our score at the end of March 2026.
of homes, for which all required Fire Risk Assessments (FRA) , had been carried out in June 2026.
This is the same as our score at the end of March 2026.
of homes for which all required asbestos surveys and re-inspections had been carried out in June 2026.
This is the same as our score at the end of March 2026.
of homes, for which all required legionella risk assessments, had been carried out in June 2026,
This is the down 2.2% from 100% at the end of March 2026.
of homes, for which all required communal passenger lift safety checks, had been carried out in June 2026.
This is up 2.5% from 97.5% at the end of March 2026.
Your Neighbourhood
This section shows how we are supporting neighbourhoods and communities, including tackling anti-social behaviour and investing in local projects.
9.2 anti-social behaviour cases open per 1,000 homes. NM01
This is the end of Q1 position (June). Our target is less than 20.
of customers said they were satisfied with how we look after shared gardens and outdoor areas in 2025.
The survey is carried out twice yearly and new data isn't available this quarter.
£40million
of social value was created last year (25/26). Our target was £5million. We report on this measure annually.
Customer Service and Complaints
This section shows how we are supporting customers, answering calls, and dealing with complaints.
of customers told us they were satisfied with our housing hub team in June 2026.
This is up from 94.4% last quarter. Our target is 95%
of customers told us they were satisfied with our technical hub team in June 2026.
This is slightly down from last quarter which was 79.8%. Our target is 85%.
122 seconds
The average time it took us to answer the phone when customers called our housing hub in June 2026.
251 seconds
The average time it took us to answer the phone when customers called our technical hub in June 2026.
of Stage 1 complaints were responded to within timescales in June 2026.
We aim to resolve stage 1 complaints within 10 working days.
of Stage 2 complaints were responded to within timescales in June 2026.
If a complaint is reviewed again, we aim to resolve it within 20 working days.
Deeper dive on our performance... what's behind the stats?
We know performance information can feel a bit dry. But the numbers matter because they tell you whether we’re doing what we said we would do, and where we need to improve.
We publish our quarterly performance results so you can track a consistent set of measures over time. Our latest published quarterly results cover April to June 2026 (above).
We also look at more detailed service information throughout the year which we share with our Board. This helps us check what’s happening, challenge ourselves where performance needs to improve and make sure action is being taken.
Because these reports are considered at different points in the year, the dates and measures won’t always be exactly the same as our quarterly performance results. For example, this update includes some information from July and August, giving a more recent and detailed view of what’s happening within services.
We’re sharing more of this information because we want you to see more than the headline figures. We want you to understand what the numbers mean, what we’re learning and what we’re doing next.
Our quarterly results will continue to provide the consistent scorecard. These updates will add more context and explain the story behind the numbers.
The following information is built from information sent to our Board on the 24 September 2026.
-
Repairs are improving, but some customers are still waiting too long.
-
Damp and mould cases are reducing, and we’re finding some issues earlier through home surveys.
-
We’re investing in homes, but we need to make the experience more consistent.
-
We’re learning from areas where antisocial behaviour has reduced.
-
Complaint response times are strong, but we need to show more clearly how complaints lead to service improvements.
-
We’re improving how we understand customers’ individual needs, so services are safer, fairer and more accessible.
Repairs are one of the services customers use most, so getting them right matters.
At the end of July, the average repair took 14.9 days, against our internal target of 14 days. Repairs satisfaction was 77.3% year to date, against our 80% target, while 80.5% of repairs were completed at the first visit.
There has been progress, but we know the service still isn’t where it needs to be. Our repairs improvements plan will continue to address the issues that matter most to customers and we’ll report progress here.
What this means for you
We’re getting through overdue work, but the service isn’t yet as consistent as we want it to be. Customers should be able to get an appointment, have confidence it will happen and know what comes next if more work is needed.
What we’re changing
We’re improving how appointments are offered when customers first contact us, creating more realistic workloads for operatives so booked appointments are less likely to move, and making sure follow-on work is arranged before an operative leaves your home.
That should mean fewer delays, fewer moved appointments, less chasing and more repairs completed first time.
For routine repairs, our service standard is to complete the work within 28 days. Emergency repairs should be made safe or completed within 24 hours.
Open damp and mould cases reduced from 1,258 in April to 917 in July, and to 740 by the end of August. That’s more than 500 fewer open cases than in April.
What the numbers show
The overall number of cases is coming down, but we’re also looking harder for problems. Our stock condition surveys are helping us identify issues such as damp and mould earlier – including problems customers may not previously have reported.
A new case isn’t always a sign that things are getting worse. Sometimes it means we’ve found a problem sooner and can do something about it. The increase in cases between May and June, for example, was linked to more home surveys identifying additional cases.
What we’re changing
We’re improving how we record and track damp and mould cases, so we can see more clearly what action has been agreed and whether it has happened. We’re also contacting customers more proactively and increasing the number of people helping to inspect homes and manage cases.
What you should expect
Our website explains the timescales that apply under Awaab’s Law, including how quickly we should investigate significant hazards, provide our findings and begin safety work.
If you’re worried about damp or mould, please tell us. Don’t wait for it to get worse.
By the end of July, we had completed 1,280 individual property improvements, including work to heating systems, bathrooms, kitchens, windows, doors and roofs.
That was 76 fewer than planned at that point in the year because some contractor work had moved into later months. At the time of our latest report, we still expected to deliver our full-year programme.
Satisfaction with planned investment was 77.7% year to date – below our 85% target, but 12% higher than at the same point last year. Satisfaction reached 85% in July and 82% in August.
What this means for you
We’re seeing improvement, but we need to make the experience more consistent. The quality of the work matters, but so does how we keep you informed before, during and after it.
We’ve introduced clearer information for customers, a new Customer Protocol and stronger standards for contractors. The early signs are positive, and we’ll keep checking whether those changes are improving customers’ experience.
Find out more about planned maintenance and improvements to your home
Looking after homes properly starts with understanding their condition.
By the end of July, 90.2% of our homes had received a stock condition survey within the previous five years. This rose to 92.91% when homes where we’d made three unsuccessful attempts to gain access were included. At the time of reporting, this had improved further to 91.83% and 95.82% respectively, keeping us on track to meet our 96% target by the end of September.
Why this matters
These surveys aren’t just about collecting data. They help us spot repairs, hazards and future investment needs earlier. Surveys have already identified issues including damp and mould and missing smoke and carbon monoxide detectors, allowing us to act.
The better we understand the condition of our homes, the better we can plan repairs, spot safety issues and keep customers safe.
This supports the commitment in our Customer Charter to keep homes safe and complete landlord safety checks on time.
Between April and July, we recorded 295 new antisocial behaviour (ASB) cases, 3.27% fewer than during the same period last year.
In the North East, new ASB cases reduced by 35.6% compared with the same period last year. That followed sustained neighbourhood work, action involving repeat offenders and closer partnership working with councils and the police.
What we’re learning
It shows that focused local action can make a difference. We’re looking at what’s working well so we can use that learning elsewhere.
We’ve also improved how quickly we respond. In July, 94.74% of ASB reports were acknowledged within our required timescale, following changes to our policy and staff training.
When you report ASB, we want you to know what happens next – not simply that we’ve logged it. We’ll assess what’s happening, consider the support you need and explain what action we can take.
Find out what counts as ASB and what you can expect from us
Report difficult behaviour in your neighbourhood
Learn more about some of the work we’ve been doing in the North East to tackle ASB:
Our latest detailed Board reporting shows that between April and July, 95% of Stage 1 complaints and 96% of Stage 2 complaints were responded to within timescale, above our 90% internal target.
Our separately published June performance was 96% for Stage 1 and 95% for Stage 2. The figures are slightly different because one covers June and the other covers the longer April-to-July reporting period.
But answering a complaint on time isn’t enough.
When something goes wrong, we need to understand why, put it right where we can and use what we’ve learned to reduce the chance of the same problem happening again.
What we need to do better
A complaint shouldn’t disappear when it’s closed. It should help us improve the service that comes next.
We publish information about our complaints process and performance, Housing Ombudsman findings and what we’re learning from complaints.
Make a complaint or see how we’re learning from complaints
Read our new annual complaints self-assessment and improvement reports
Good service doesn’t always mean treating everybody in exactly the same way. It means understanding what you need and making changes to the way we provide a service where that would help.
12,797 customers have told us about a vulnerability or circumstance we may need to consider when providing a service.
We’ve also introduced a clearer way to record adjustments made because of individual circumstances, so colleagues can better understand and respond to customers’ needs.
That can mean something very practical: changing how we communicate with someone, allowing extra time at the door or responding differently to a repair because of someone’s circumstances.
What this means in practice
Collecting information isn’t the outcome. Using it to provide a safer, fairer and more accessible service is.
We’re also starting proactive work to contact households we haven’t heard from during the previous 12 months, prioritising customers where the information we hold suggests there may be additional support needs.
That supports our Customer Charter commitment to provide services that are fair and accessible and communicate in ways that work for customers.
The numbers matter but what we do with them matters more.
No single performance figure tells us everything about a service.
That’s why we look at performance, customer feedback, complaints and what our colleagues are seeing and hearing. Together, they help us understand what is happening, why it’s happening and what needs to change.
That information is reviewed across Accent. Our teams and senior leaders look at performance and take action where it’s needed. Our committees and Board challenge us on whether we’re doing enough. Customers help us understand whether changes are making a difference. And we report back openly so you can hold us to account.
We’ll continue to publish our quarterly performance so you can track our results consistently over time. Through updates like this, we’ll also share more of the detail that helps explain what’s changing and why.
That means you can see the headline results, the story behind them and what we’re doing next.
Our next report will be released in the days following our next Board meeting on the 19 November 2026.
Read our Improvement Plan
Your feedback continues to play an important role in shaping our priorities and helping us improve.
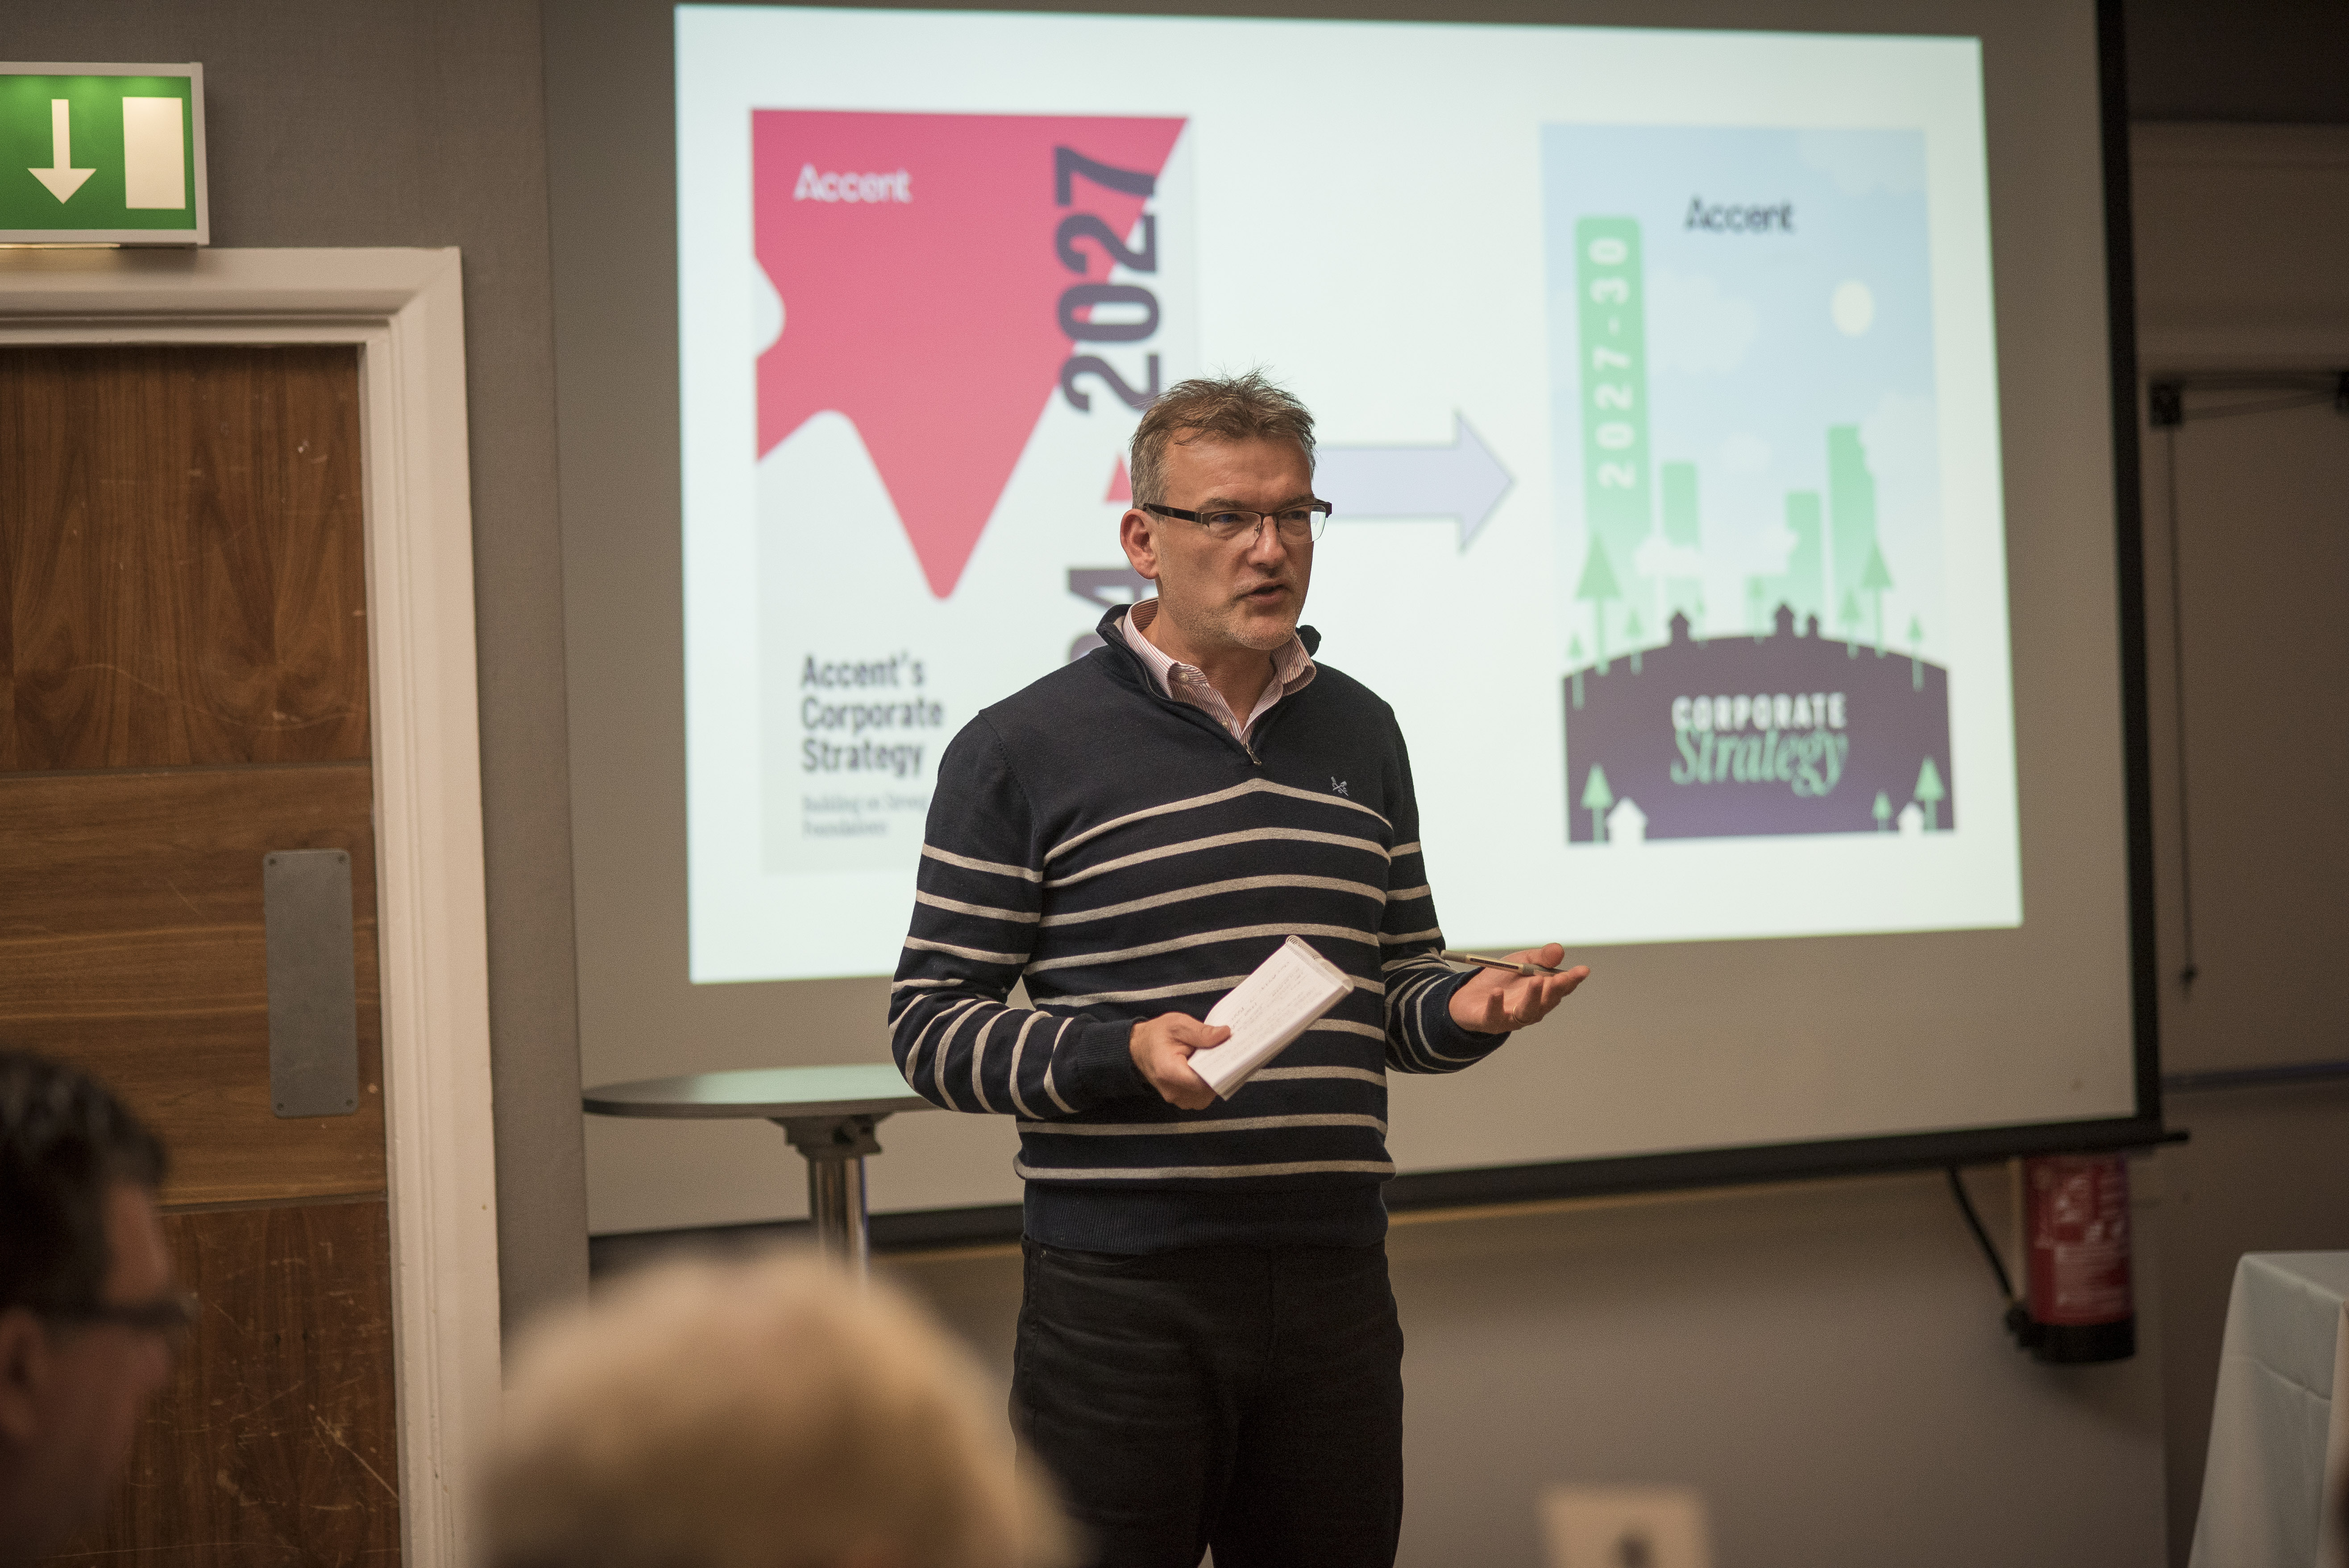
Our Improvement Plan sets out the actions we are taking to improve customer experience and service performance across Accent. We regularly review and update this plan so customers can see the progress we are making.