Accent is a national organisation with a community focus. Since 1966, we’ve worked to provide tens of thousands of affordable quality homes to families across the country.
We provide affordable, sustainable, safe homes
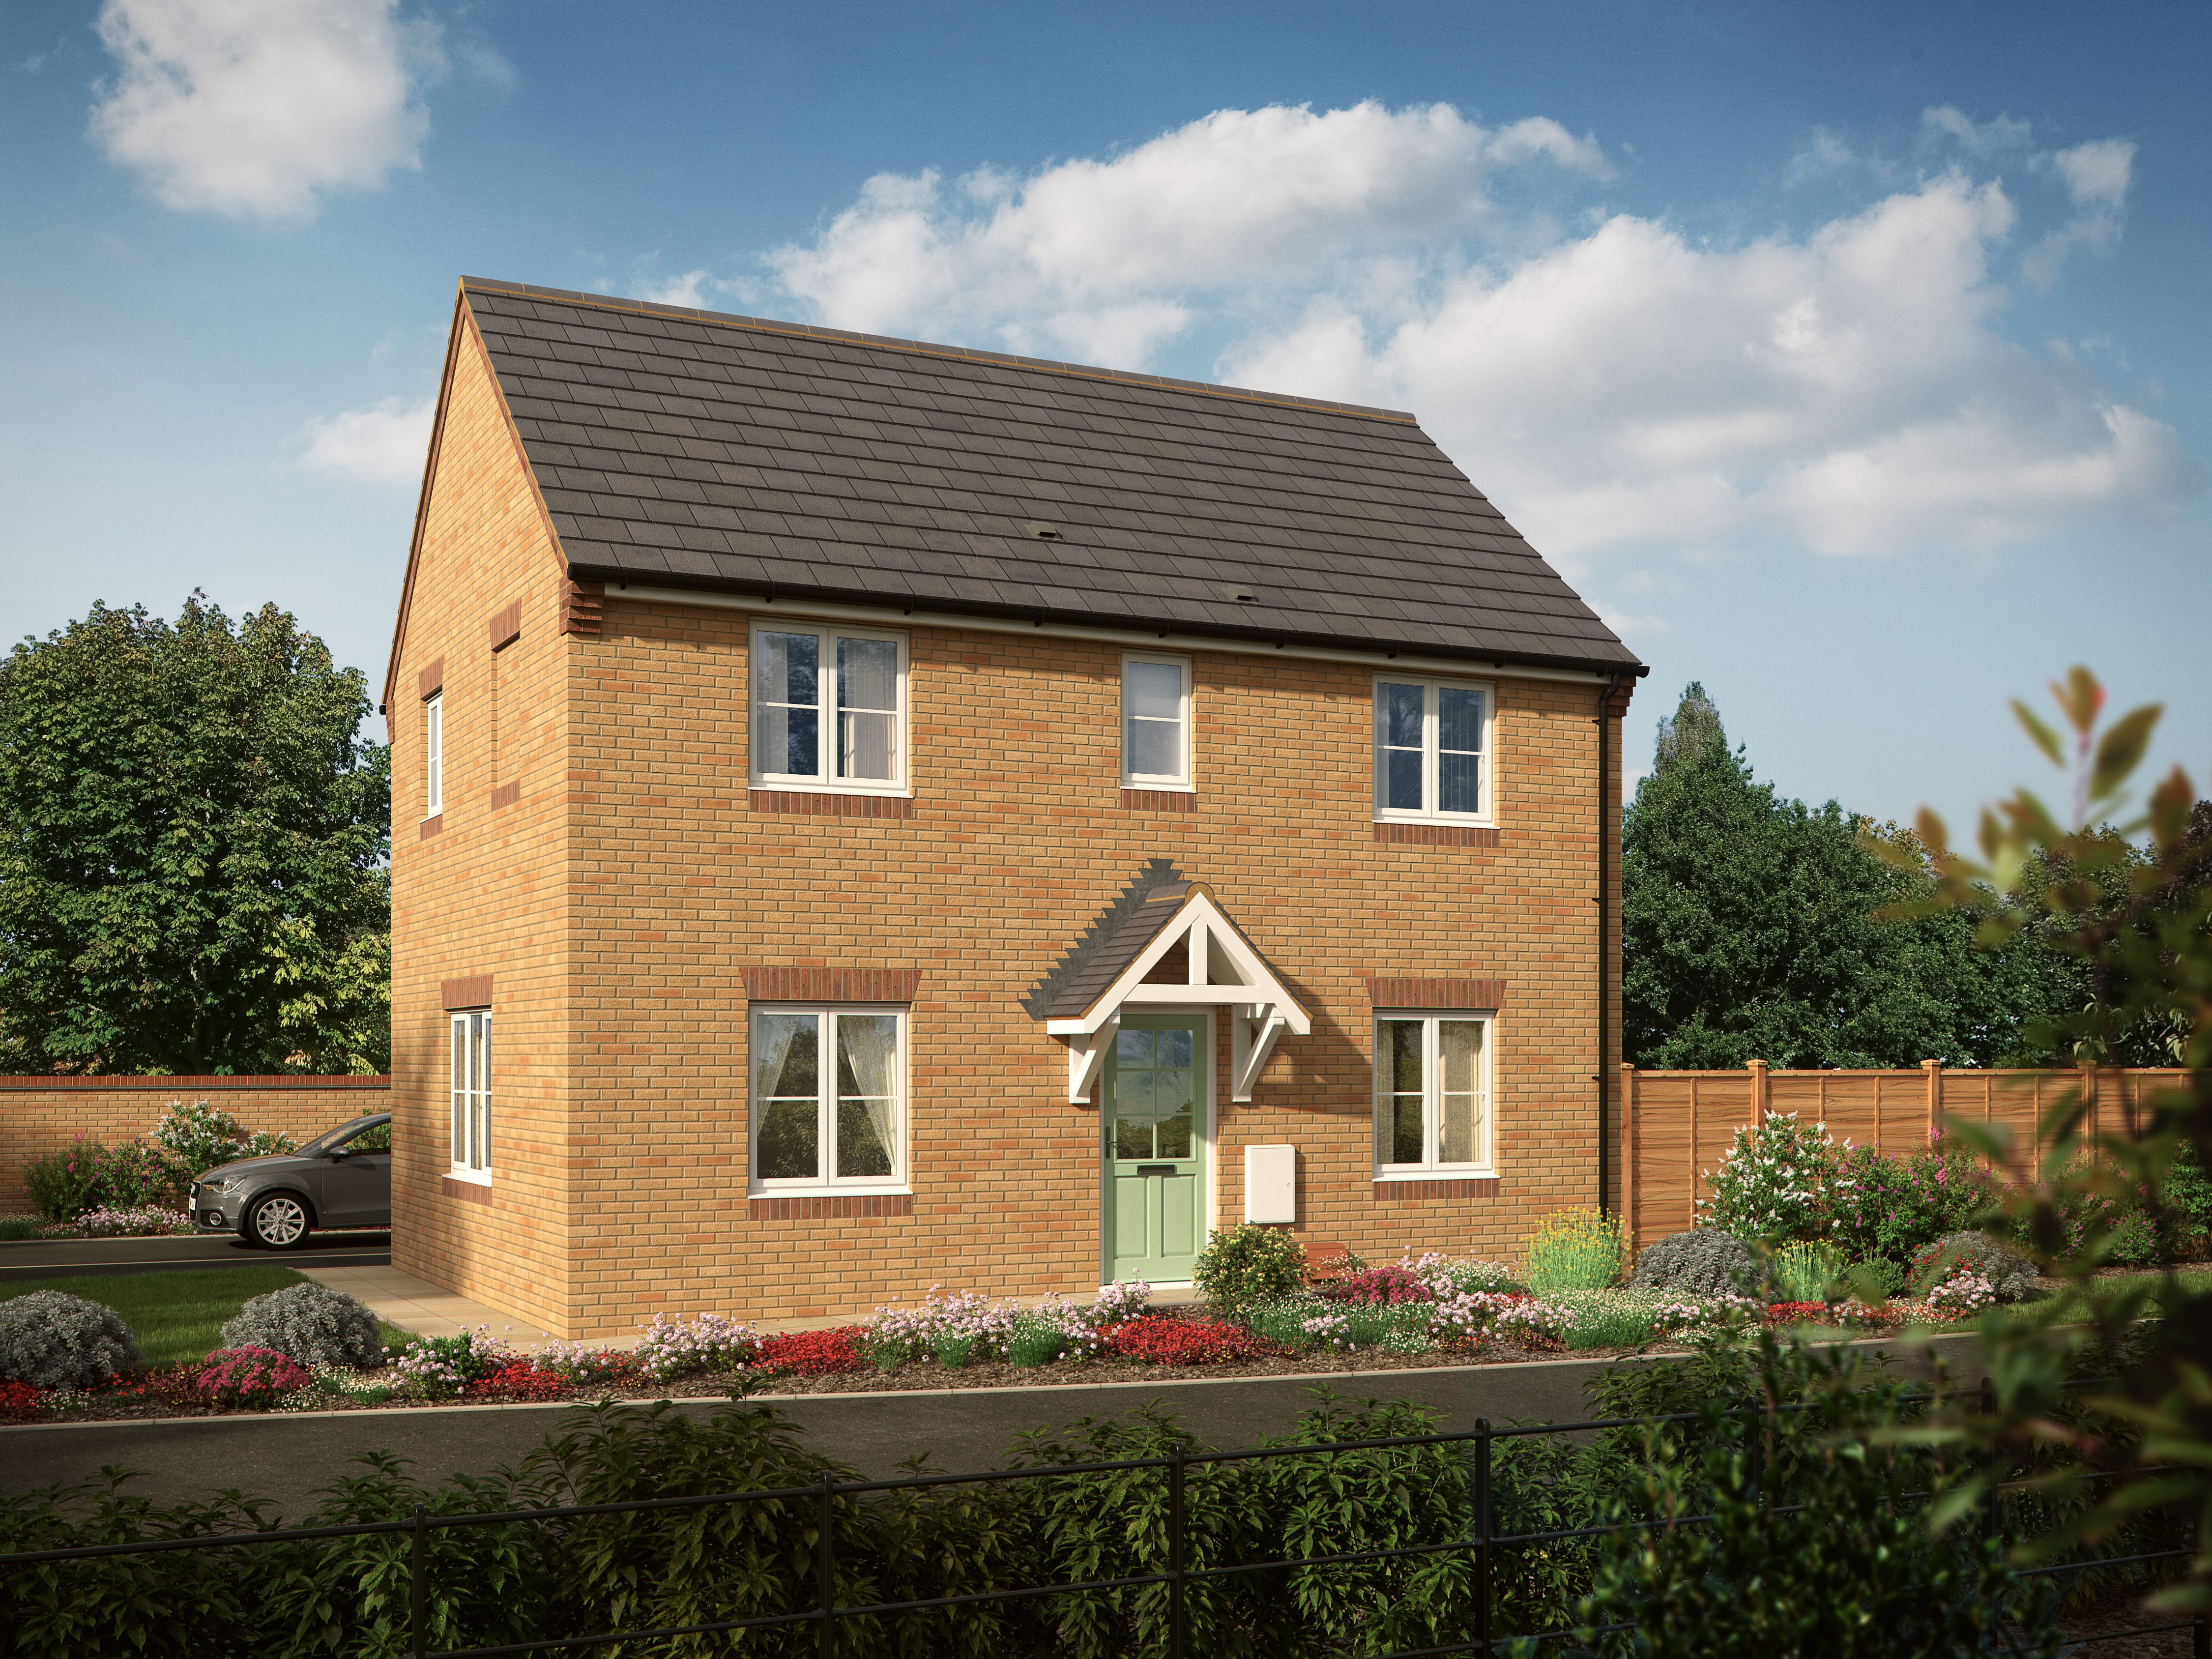
We create better places for people to live by building and maintaining well-designed, affordable housing – something the country urgently needs, but has little of.
Today, driven by the impact our work has, we provide affordable homes and services to over 40,000 customers in England.
We are committed to maintaining our homes, adapting and upgrading them to ensure they meet modern living standards, accessibility needs, safety regulations and more – and are always improving our services by working closely with our customers, putting their feedback at the heart of our decision-making.
Caring for our customers means caring for their environment – which is why we’re now putting sustainability at the heart of our development work with ambitious, energy-efficient designs.
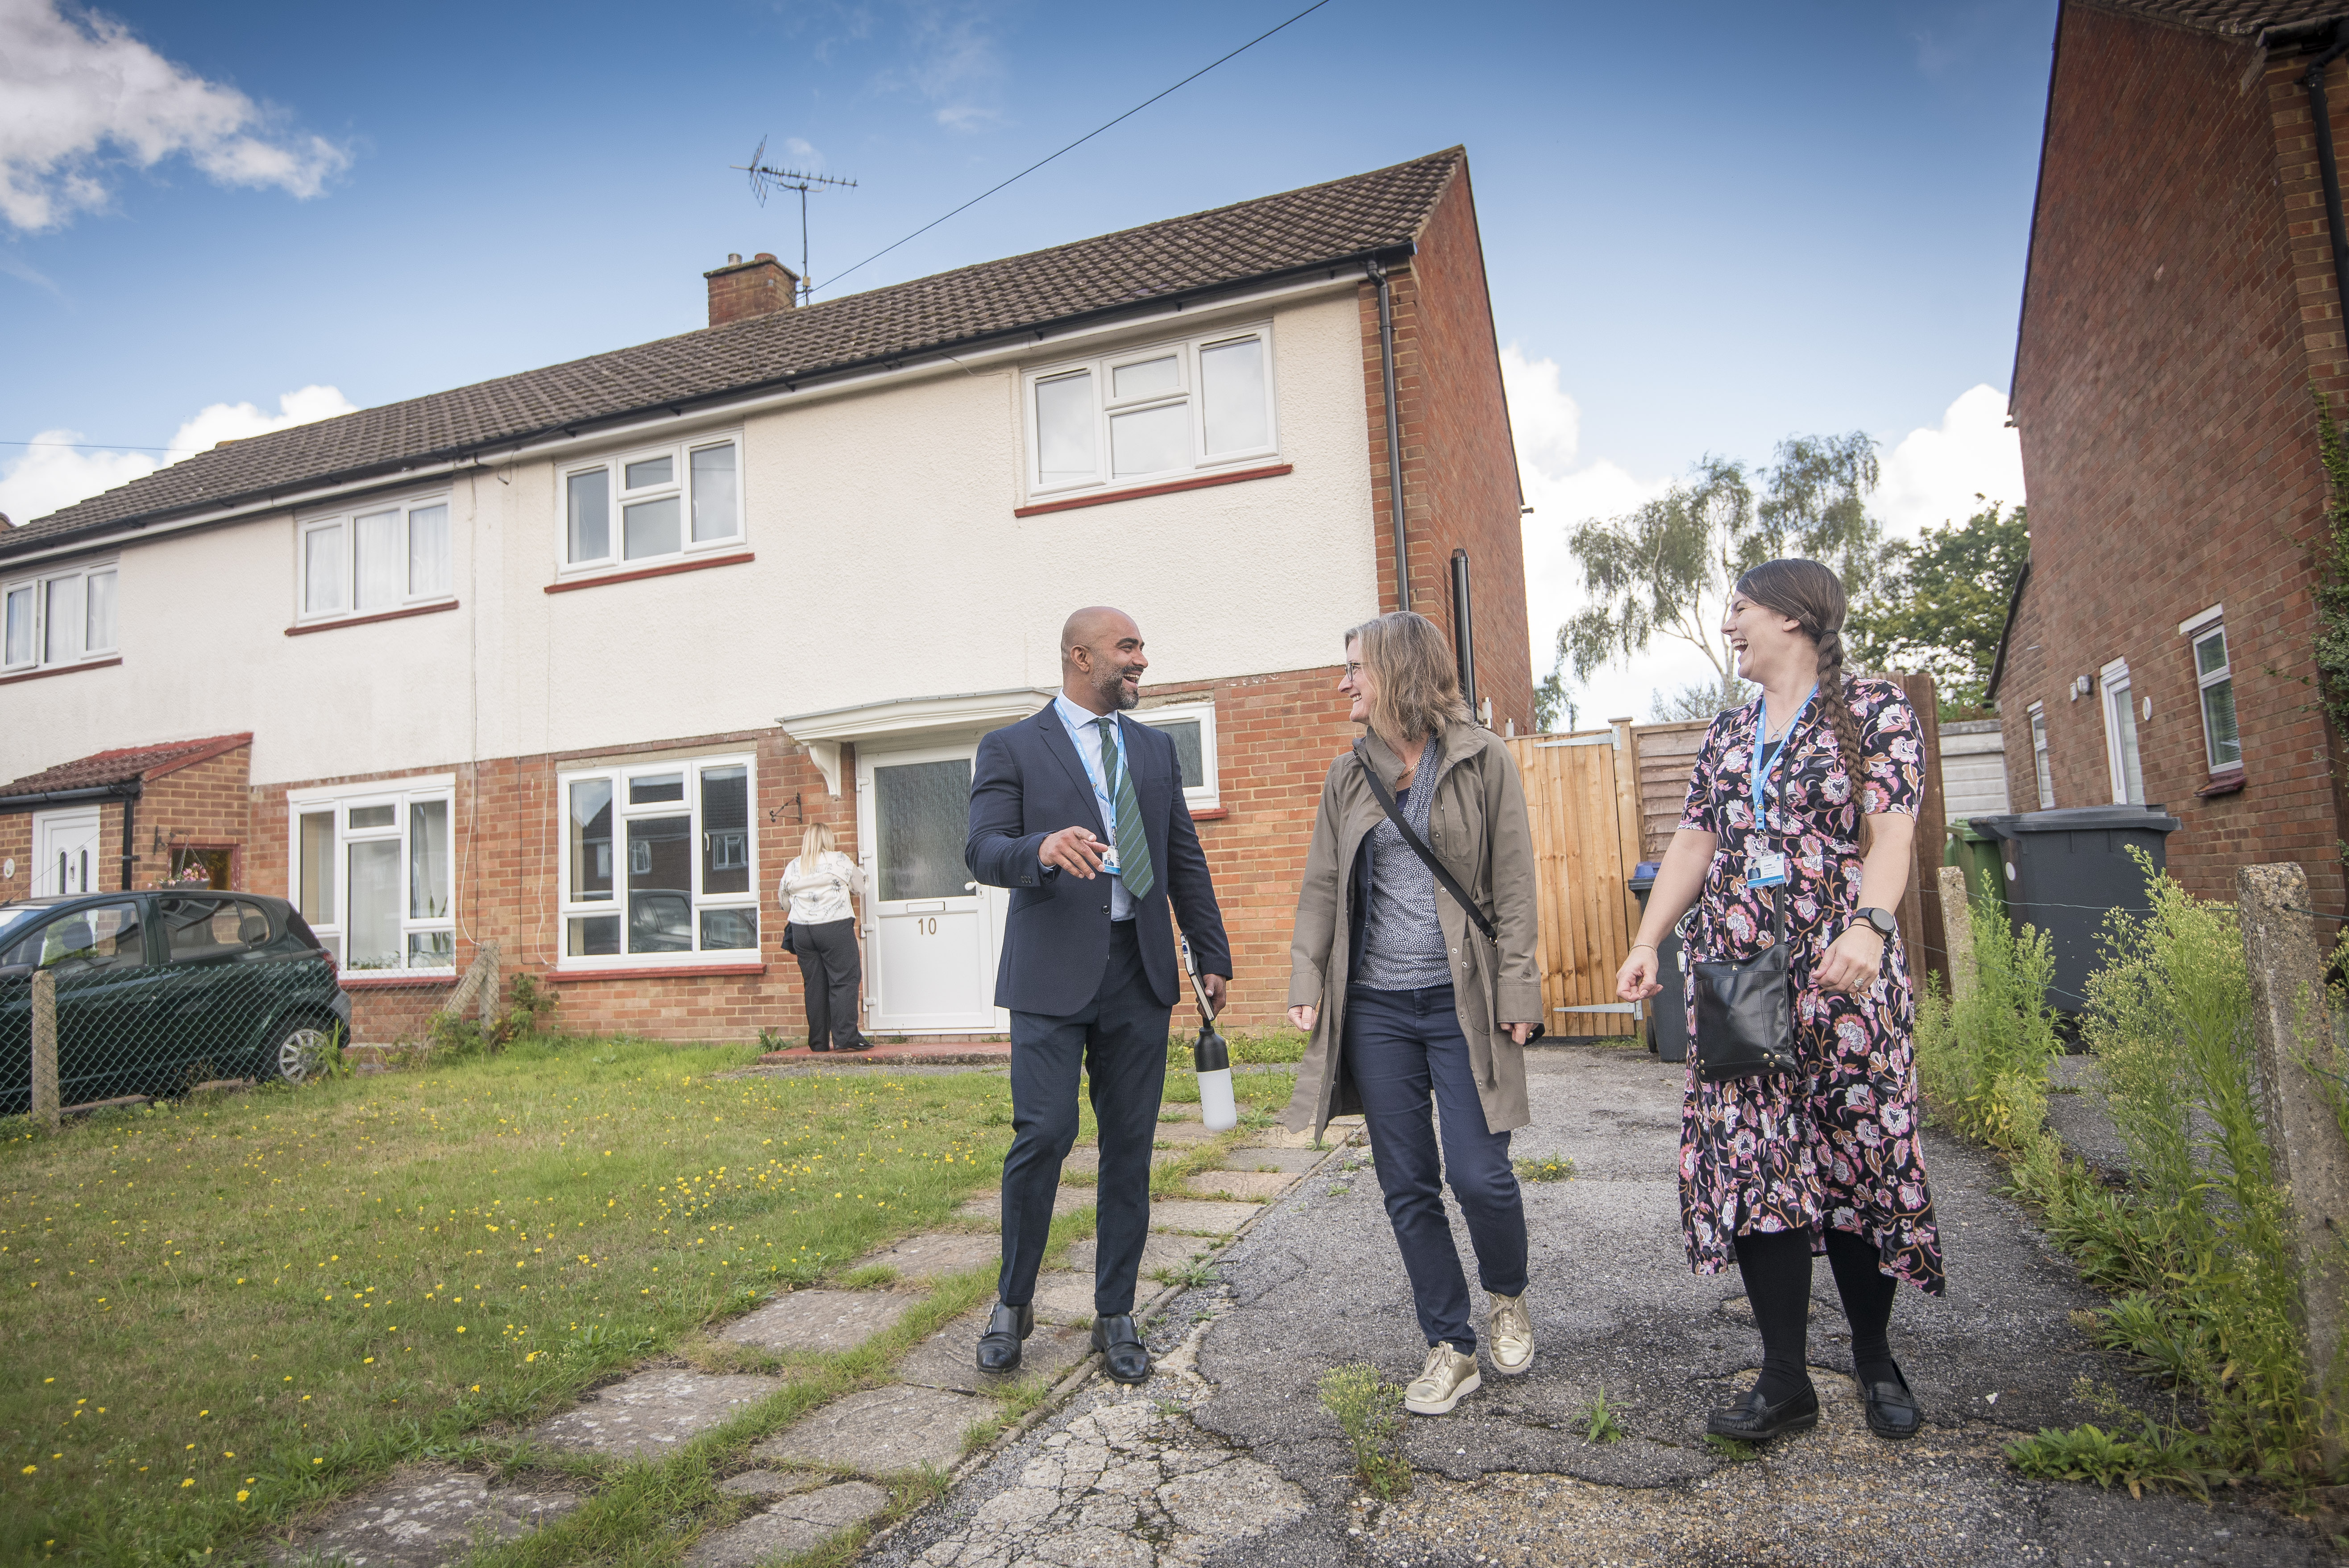
We’re always on the lookout for partnerships and opportunities that advance and accelerate our work, helping ensure our customers feel supported, happy and comfortable living in their home and community.

Performance and Tenant Satisfaction Measures (TSMs)
Find out how well our customers say we’re doing according to our Tenant Satisfaction Measures and read detailed breakdowns of how well we’re providing our housing service.
Read our Annual Report for Customers to see last year's scores and what we’ve done as a result.
Our vision
Accent exists to give as many people as possible access to safe, sustainable, affordable housing that offers the very best living standards.
We’re dedicated to the upkeep and maintenance of our existing homes, prioritising investment, with a focus on building sustainable neighbourhoods. We aim to be an anchor, building partnerships, and signposting services and are always open to opportunities.
And, as the UK’s housing crisis deepens, we're scaling up the number of new homes we’re building to offer greater stability, security and foundations for better living – to both our customers and our nation.
We’re driven by our values, strong vision and core purpose of providing top-quality homes and services for our customers – especially those on lower incomes.
Every single one of our customer's voices matters to us. Their views drive our decisions, influence our policies and inspire our colleagues to work to deliver the best outcomes for every Accent customer.
Above all, we prioritise delivering our core services to the best standard possible, so our customers can feel it’s good to be home.
How many homes do we have?
We have over 21,000 homes throughout England to over 40,000 people across the country, with homes in the East, South, North East and North West.
Our history
Accent was formed in 1966, when it provided homes in Yorkshire, the North East and the North West, and was called Bradford & North Housing Association.
In 2004 we rebranded and became Accent, and a year later, in 2005, we merged with Nene Housing. This expanded our work into the East of England, and in 2006 we grew again when we merged with Peerless Housing in the South.
Our values
Our values are at the heart of everything we do at Accent – they are our guiding principles, they define our culture and inform every decision we make to ensure we offer the very best customer experience.
We do whatever it takes to get it right for our customers.
Being driven means we approach challenges with fearlessness and energy. We want to improve people’s lives which is an ambitious goal and the only way we will do that is by being highly motivated.
A lot of our drive comes from customers themselves; whose stories are a constant source of inspiration and a reason to keep on doing what we do.
We challenge ourselves to improve every day.
We are smart enough to know that we don’t always get it right and smart enough to quickly adapt, change and improve. Acting smart also means we find the most efficient ways to make improvements.
Our team are all individually smart too because we believe an empowered and talented team is the way to success. We’re always investing in and celebrating our team.
We ensure that every voice is heard through collaboration and valuing different perspectives.
We accept and respect people for who they are, and we don’t judge people who are different to us. We believe that it's our differences that make us stronger and diverse thinking makes our decisions better. We know that only by collaborating as one team will we deliver a brilliant service to our customers.
We are genuine people who care.
Accent is serious about providing quality homes and giving people the best chance at achieving everything they hope to. People are at the heart of everything we do and always have been.
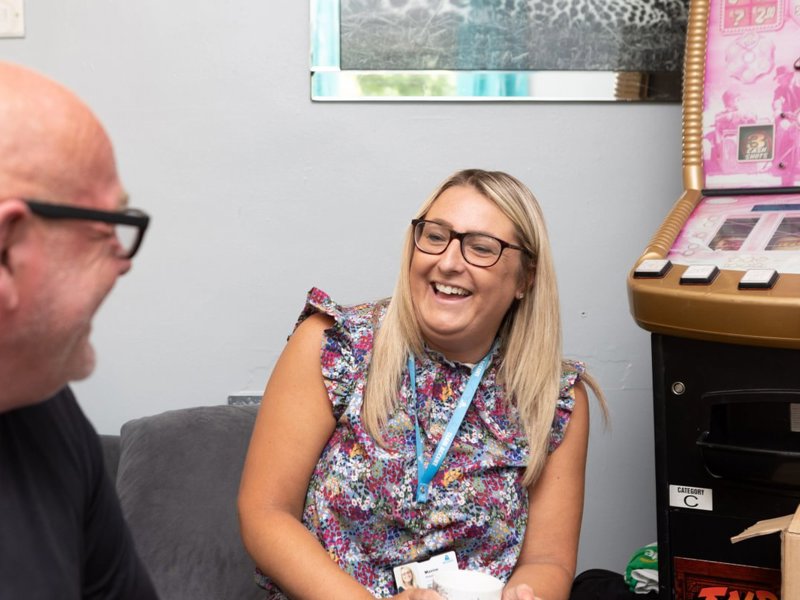
Our relationships with customers can be transactional but for others, we provide a vital service that is more than housing. We care about their lives and gain trust by being here when we are needed.
Our plans for the future
We’re always working to better the services we offer, increase our customers’ satisfaction and continually adapt to meet the very best in living standards.
Our work up to 2027 is guided by our corporate strategy.
Quality homes for the future
We want to ensure Accent is both environmentally and financially sustainable long term, so we’re focusing on building and maintaining more, better quality homes, and providing more energy-efficient homes for new customers.
Excellence through customer-influenced services
We’re committed to a most customer-led approach to improving our services, by involving customers as much as possible, listening to their feedback and adapting our services to meet their needs.
Investing for success
Everyone at Accent should feel valued, respected and appreciated for who they are, whether they're a customer or a colleague. We’re using continuous engagement to understand the experience of our colleagues better, helping create a better, more motivating work environment.
Lasting change
As leaders in the housing sector, we’re uniquely positioned to address the fallout of the housing crisis. We’re using our authority to call for long-term change, sharing the key messages of the housing sector through sector-wide lobbying.